Qualitative Data Analysis

Once data collection is completed, all the data must be organized and cleaned. This includes transcribing interview and focus group recordings, organizing field notes, writing memos, and consolidating forms, and then uploading the data into a qualitative data analysis (QDA) software program, such as ATLAS.ti or NVivo. QDA software does not analyze data, but instead manages and stores data (including text, graphic, audio and visual data files.) Unique software features allow researchers to classify, sort, arrange, organize, examine relationships, and build links and models between concepts.
Data analysis involves scrutinizing the data to understand the main concepts. Analysis allows the researcher to ask two main questions:
- What has been done about the research question?
- How are the findings reflected in the data?
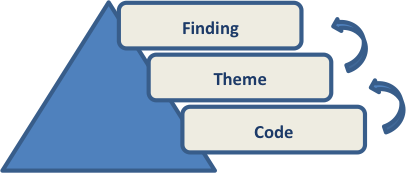
In data analysis, the researcher moves between levels of understanding, as illustrated in the picture below.
- Base level: Code
- Next level: Theme
- Top level: Finding
Codes are labels assigned to segments or chunks of data which identify a general process, issue, or topic. The process of coding “reduces data into meaningful segments and gives names to the segments” (Creswell 148). It is recommended that a codebook is established to keep track of the codes being created and what the codes mean. Using a codebook will help to standardize coding between researchers and will ensure that each person understands what the codes mean. For example, a codebook may include codes and definitions, such as:
Code: HCP interaction (HCP = health care provider)
Definition: The participant refers to an interaction with a health care provider.
Interaction includes in-person/face-to-face, on the phone, etc. Health care provider includes any person to whom the participant seeks out for medical/health care.
Themes are the next level of analysis, where codes, representing groupings of data, are clustered to reflect patterns in the data. The themes are then presented as research findings. Note that the findings will be different in their content and presentation depending on the approach used. For example, a evidence of a finding may be in the form of a quote from an interview transcript or in the form of an excerpt from field notes.
Maxine tells Jonathan that she won’t go further into qualitative data analysis until the team is ready for that stage. But if Jonathan wants to do some advance preparation on data analysis, Maxine recommends that he complete an “Introduction to Qualitative Analysis using ATLAS.ti” training program.